I’ve always been fascinated by geography. As a child, I memorized the heights of mountains, the populations of cities, and the areas encompassed by various states and countries. I can still recite from memory many of these numbers – at least based on the 1960 Rand McNally World Atlas. Part of my fondness for geography is no doubt based on my brain’s ability to recall numbers but very little else.
Most geographic ecologists are fond of numbers, exploring numerical questions such as how many organisms or species are there in a given area, or how large an area does a particular species occupy? They then look for factors that influence the distribution and abundance of species or groups of species. Given that biologists estimate there may be up to 100 million species, geographic ecologists have their work cut out for them.
As it turns out, most geographic ecologists have worked on plants, animals or fungi, while relatively few have worked on bacteria and archaeans (a very diverse group of microorganisms that is ancestral to eukaryotes).
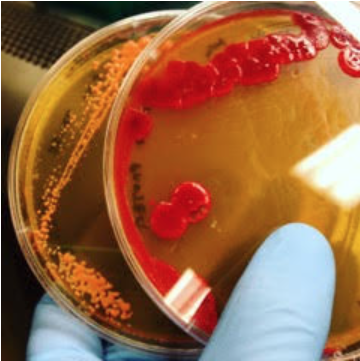
Two petri plates with pigmented Actinobacteria. Credit: Mallory Choudoir.
Until recently, bacteria and archaeans were challenging subjects because they were so small and difficult to tell apart. But now, molecular/microbial biology techniques allow us to distinguish between closely related bacteria based on the sequence of bases (adenine, cytosine, guanine, and uracil) in their ribosomal RNA. Bacteria which are identical in more than 97% of their base sequence are described as being in the same phylotype, which is roughly analogous to being in the same species.
As a postdoctoral researcher working in Noah Fierer’s laboratory with several other researchers, Mallory Choudoir wanted to understand the geographic ecology of microorganisms. To do so, they and their collaborators collected dust samples from the trim above an exterior door at 1065 locations across the United States (USA).

Dr. Val McKenzie collects a dust sample from the top of a door sill. Credit: Dr. Noah Fierer.
The researchers sequenced the ribosomal RNA from each sample to determine the bacterial and archaeal diversity at each location. Overall they identified 74,134 gene sequence phyloypes in these samples – that took some work.
On average, each phylotype was found at 70 sites across the USA, but there was enormous variation. By mapping the phylotypes at each of the 1065 locations, the researchers were able to estimate the range size of each phylotyope. They discovered a highly skewed distribution of range sizes, with most phylotypes having relatively small ranges, while only a very few had large ranges (see the graph below). As it turns out, we observe this pattern when analyzing range sizes of plant and animal species as well.
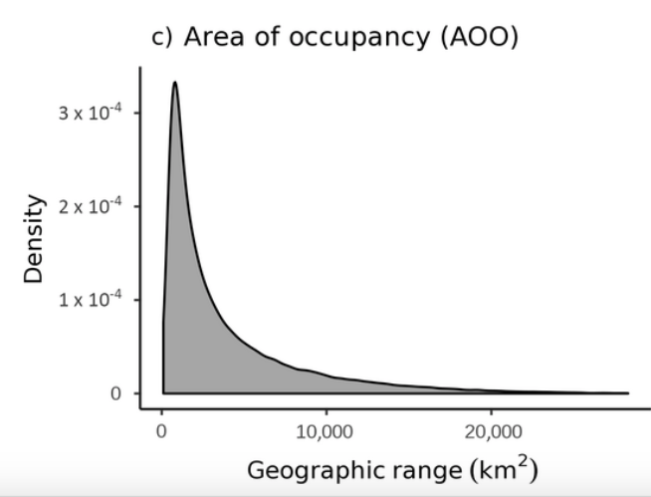
Mean geographic range (Area of occupancy) for each phylotype in the study. The y-axis (Density) indicates the probability that a given phylotype will occupy a range of a particular size (if you draw a straight line down from the peak to the x-axis, you will note that most phylotypes had an AOO of less than 3000 km2
Taxonomists use the term phylum (plural phyla) to indicate a broad grouping of similar organisms. Just to give you a feel for how broad a phylum is, humans and fish belong to the same phylum. Some microbial phyla had much larger geographic ranges than others. Interestingly, it was not always the case that the phylum with the greatest phylotype diversity had the largest range. For example, phylum Chrenarchaeota had the greatest median geographic range (see the graph below), but ranked only 19 (out of 50 phyla) in number of phylotypes (remember that a phylotype is kind of like a species in this study).
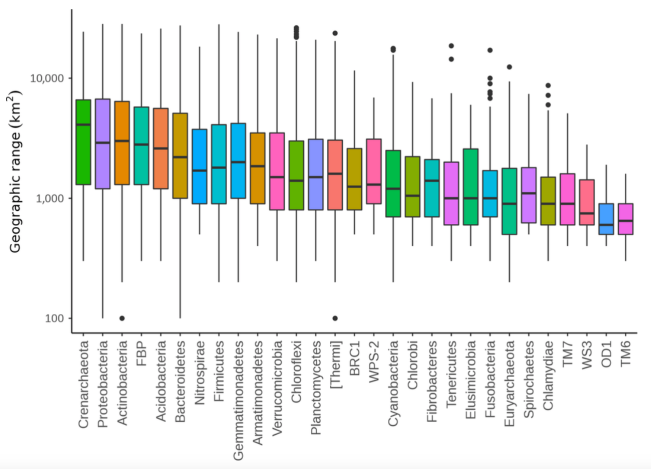
Box plots showing range size distribution for individual phyla. Middle black line within each box is the median value; box edges are the 25th and 75th percentile values (1st and 3rd quartiles). Points are outlier phylotypes. Notice that the y-axis is logarithmic.
With this background, Choudoir and her colleagues were prepared to investigate whether there were any characteristics that might influence how large a range would be occupied by a particular phylotype. We could imagine, for example, that a phylotype able to withstand different types of environments would have a greater geographic range than a phylotype that was limited to living in thermal pools. Similarly, a phylotype that dispersed very effectively might have a greater geographic range than a poor disperser.
The researchers expected that aerobic microorganisms (that use oxygen for their metabolism) would have larger geographic ranges than nonaerobic microorganisms, which are actually poisoned by oxygen. The data below support this prediction quite nicely.
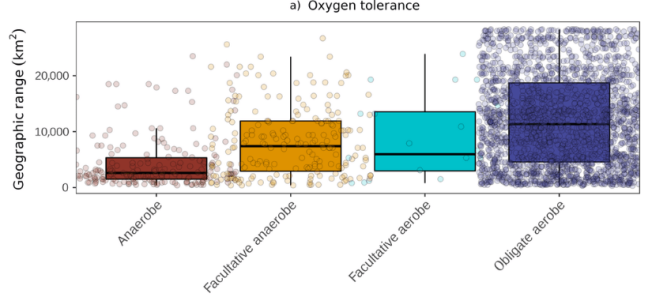
Geographic range size in relation to oxygen tolerance. In this graph, and the graphs below, the points have been jittered to the right and left of their bar for ease of viewing (otherwise even more of the points would be on top of each other).
Some bacterial species form spores that protect them against unfavorable environmental conditions. The researchers expected that spore-forming bacteria would have larger geographic ranges than non-spore-forming bacteria.
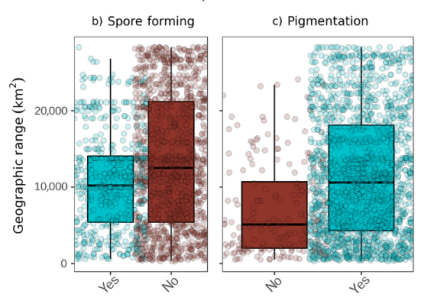
Geographic range in relation to spore formation (left graph) and pigmentation (right graph).
Choudoir and her colleagues were surprised to discover exactly the opposite; the spore forming bacteria had, on average, slightly smaller geographic ranges. Choudoir and her colleagues also expected that phylotypes that are protected from harsh UV radiation by pigmentation would have larger geographic ranges than unpigmented phylotypes – this time the data confirmed their expectations.
The researchers identified several other factors associated with range size. For example, bacteria with more guanine and cytosine in their DNA or RNA tend to have larger geographic ranges. Some previous studies have shown that a higher proportion of guanine and cytosine is associated with greater thermal tolerance, which should translate to a greater geographic range. Choudoir and her colleagues also discovered that microorganisms with larger genomes (longer DNA or RNA sequences) also had larger ranges. They reason that larger genomes (thus more genes) should correspond to greater physiological versatility and the ability to survive variable environments.
This study opens up the door to further studies of microbial geographic ecology. Some patterns were expected, while others were surprising and beg for more research. Many of these microorganisms are important medically, ecologically or agriculturally, so there are very good reasons to figure out why they live where they do, and how they get from one place to another.
note: the paper that describes this research is from the journal Ecology. The reference is Choudoir, M. J., Barberán, A., Menninger, H. L., Dunn, R. R. and Fierer, N. (2018), Variation in range size and dispersal capabilities of microbial taxa. Ecology, 99: 322–334. doi:10.1002/ecy.2094. Thanks to the Ecological Society of America for allowing me to use figures from the paper. Copyright © 2017 by the Ecological Society of America. All rights reserved.

One reason that I like to read these “Tales” is that it takes my brain to unexpected places. There is so much we humans don’t know about our world. Bacteria from external door trim, interesting choice. I wonder why that location and not a kitchen sink or under the welcome mat?
My studies for my degree in Geography never even hinted at the concept of micro-geography.
Thanks Fred
LikeLike
One feature of ecology that is so appealing is its breadth. It considers what’s going on at all levels of the biological hierarchy, from molecules to biomes. Not sure why they considered trim – I’m guessing every location has it, and dust can collect there for a long time (I have not cleaned off my door trim , I think ever).
LikeLike